In today’s world, where every minute and dollar counts, a recent study has brought to light a staggering fact: the average American spends a whopping $8,466 and 239 hours each year commuting. That’s nearly 19% of the average commuter’s income and roughly ten days a year, based on Clever Real Estate’s analysis
The Real Cost of Getting to Work
Think about it: $8,466 annually isn’t just a dent in the wallet; it’s a significant investment. This includes not just gas, which averages $867 a year, but also car maintenance, adding up to $410 yearly. And let’s not forget the 239 hours spent on the road or in transit – that’s equivalent to a 10-day vacation or countless hours that could be spent learning a new skill or relaxing at home.
Why Commuting Costs Are Skyrocketing
Now, why this sudden hike in commuting expenses? It’s a mix of several factors. Inflation, global events and changes in oil production have led to rising fuel prices. This doesn’t just hit car owners; public transport users also feel the pinch with increasing fares.
What Employees Now Want
Let’s talk about what this means for the workplace. A report from video-conferencing device company Owl Labs found that a vast majority of workers, about 94%, are open to returning to the office, but their terms have changed. They’re looking beyond the typical office perks; they want tangible support like commuting cost coverage. Nearly two in five hybrid workers say they’d head to the office more willingly if these costs were taken care of by their employers.
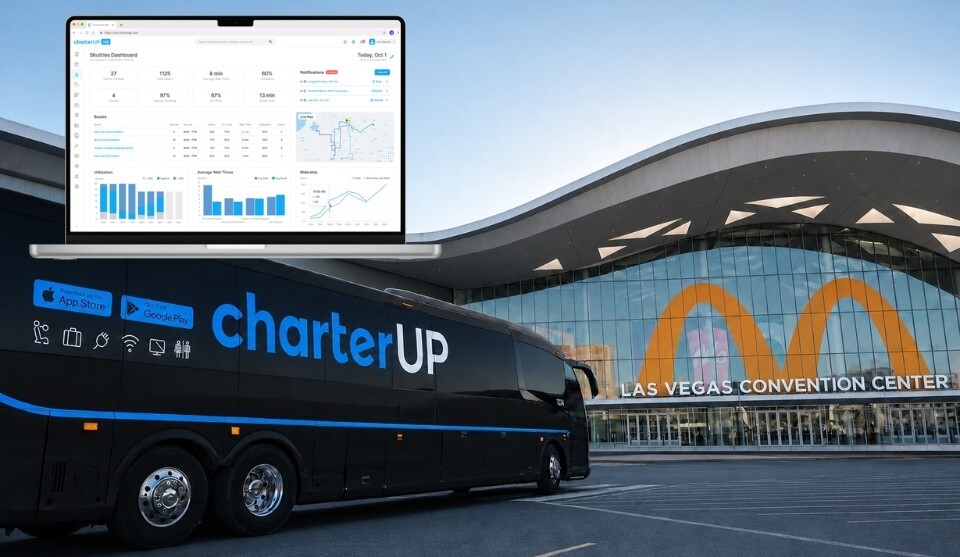
CharterUP’s Role in This Changing Scenario
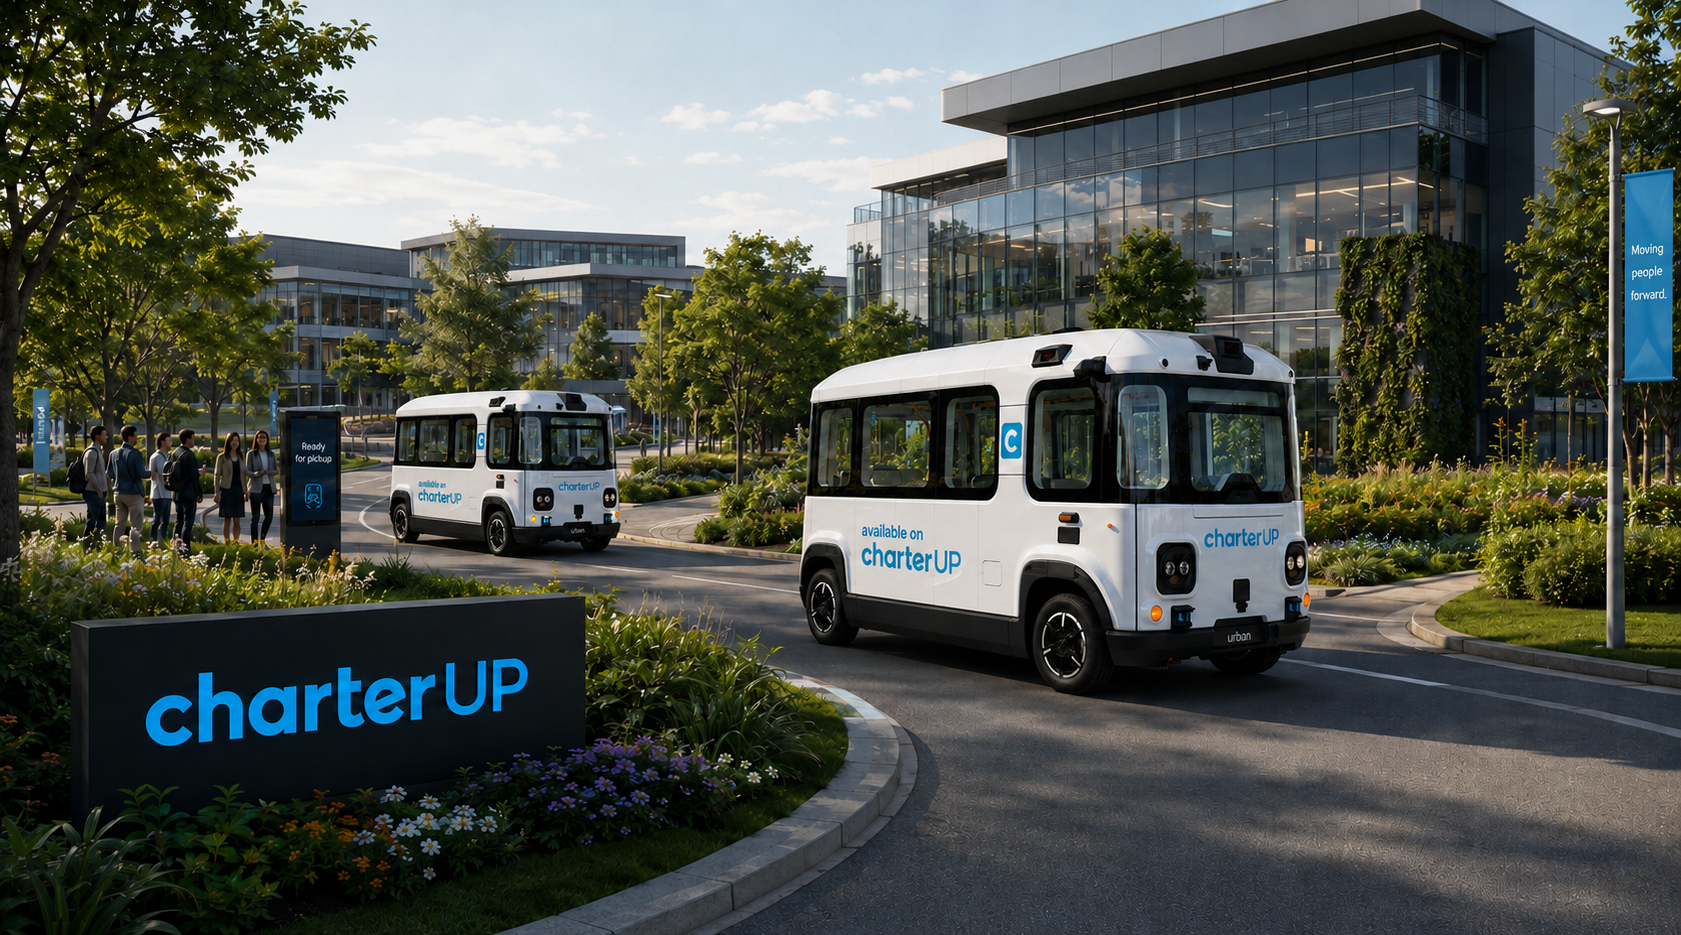
This is where CharterUP steps in. We see these changes not just as challenges but as opportunities to innovate. By providing accessible, reliable and transparent transportation solutions, we offer a practical alternative to the conventional (and expensive) commuting grind. Our employee transportation services are designed to ease the financial and time burden of commuting, aligning with the needs of today’s workforce.
Wrapping It Up
So, what do these changes in commuting costs and preferences mean for us? They signal a shift in how we approach work and life balance. As we adapt to these evolving needs, CharterUP is committed to being part of the solution. We are here to support this transition, offering transportation solutions that resonate with the modern workforce’s needs and charter bus pricing that works for individual needs, striking a balance between efficiency, comfort and cost-effectiveness.